Reports User Guide
The Way Back (TWB) Support Service Minimum Data Set is an extension of the Primary Mental Health Care Minimum Data Set (PMHC MDS); current PMHC MDS online User Guide for Reports is available to be viewed at https://docs.pmhc-mds.com/projects/user-documentation/en/latest/reporting.html.
How to produce a Wayback report
You can produce the Wayback report by following these steps:
Navigate to the Reports tab
Click the Wayback tab (NOTE: this tab will only be displayed when TWB data has been added to the PMHC MDS)
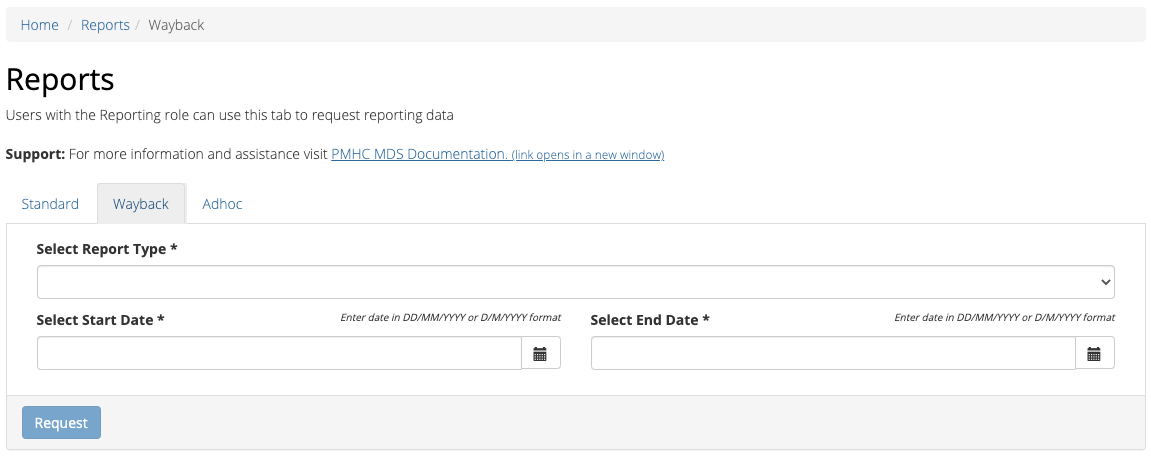
Select the Report Type
Select the Financial Year & Reporting Period, or Start/End Date & Reporting Level
Select the name of the Provider Organisation from the drop down list, if not pre-filled
Click the blue View button, or the selected format and click the Download button
Please note: for the W1, click the blue Request button
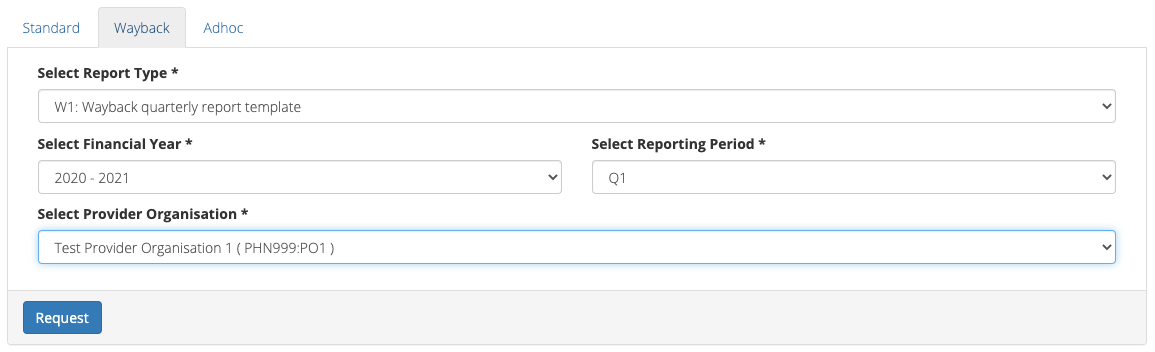
Fig. 4 A dialogue box will be displayed, showing that the file is being requested from the server
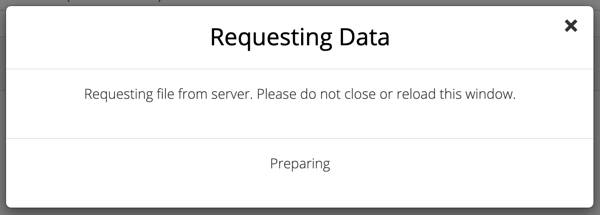
Fig. 5 When the file is ready, a ‘File ready for download’ message will be displayed Click the blue Download button
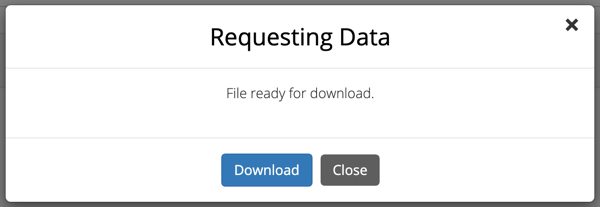
Fig. 6 An Excel spreadsheet will be downloaded to your computer
NOTE: The W1 spreadsheet will then require some manual completion of information not available to the PMHC-MDS system. Once complete send it on to Beyond Blue or your PHN.
Types of Wayback reports
Report W1: Wayback Quarterly Report Template
The Way Back Quarterly reporting function allows users to automatically populate The Way Back Quarterly Report using data contained in the PMHC MDS. This spreadsheet will then require some manual completion of information not available to the PMHC-MDS system before providing to Beyond Blue or your PHN.
Many of the items reported are summarised over two time periods - reporting period and year to date. The former is always a full quarter worth of data as selected in the drop down boxes on the report generation page, unless the most recent quarter has been selected in which case it will be all data from the start of the current quarter until the day the report is generated. Financial years are listed in the report dropdowns with both relevant calendar years listed (e.g. 2020 - 2021). The year to date figure is always from July 1 of the earlier calendar year until either the end of the selected reporting period or the date the report was generated if the current quarter is selected.
Data in this report is all associated with episodes that appear in the TWB Episode table, - a ‘!wayback’ tag on the main episode table is NOT sufficient.
The first section of the report explicitly details the dates covered by the reporting period and the year to date, as well as identifying the time at which it was generated.
Activity Data
- New Client Episodes
This is the number of episodes commenced during the relevant period (reporting or YTD). A key concept here is the episode start date. This is defined as the date of the earliest contact, even if the client is a no-show, but only if there is at least one attended service contact during the reporting period.
- Number of Completed Episodes (Exits)
Any episode with an Episode - End Date during the relevant period.
- Number of Completed Episodes (Service Complete)
The subset of Completed Episodes as defined immediately above that have an Episode - Completion Status of 1: Episode closed - treatment completed
- Number of Administratively Closed Episodes
The subset of Completed Episodes as defined above that have an Episode - Completion Status between 2 and 6 inclusive, indicating an administrative closure.
Client Profile
The first three elements in the Client Profile summarise new episodes by client gender:
- Male
The number of episodes started during the relevant period where the Client - Gender is indicated as 1: Male
- Female
The number of episodes started during the relevant period where the Client - Gender is indicated as 2: Female
- Other
The number of episodes started during the relevant period where the Client - Gender is indicated as 3: Other
The next 2 elements summarise new episodes for clients in at risk groups
- Aboriginal and Torres Strait Islander
The number of episodes started during the relevant period where the Client - Aboriginal and Torres Strait Islander Status was 1,2 or 3, indicating Aboriginal or Torres Strait Islander origin or both.
- LGBTIQ
The number of episodes started during the relevant period where the client indicates a TWB Episode - Sexual Orientation other than 1: Straight or heterosexual or 9: Not stated.
The final section in the Client Profile is Age Profile, summarising the number of new episodes in the relevant period by the client’s age group at the time the episode began. This is derived from Client - Date of Birth, using only records where Client - Estimated Date of Birth Flag is not a dummy date (code 8) and is not missing (code 9).
Referral Profile
The Referral Profile summarises referral criteria (essentially eligibility codes) and sources for episodes starting in the reporting period. There is no corresponding profile for the Year To Date.
- Primary Referral Criteria
The number of episodes starting in the reporting period with TWB Episode – Eligibility Type Code: 1
- Secondary Referral Criteria
The number of episodes starting in the reporting period with TWB Episode – Eligibility Type Code: 2
- Referral Source
The number of episodes starting in the reporting period with Episode - Referrer Organisation Type codes of:
- Hospital ED
7: Emergency Department
- Hospital Ward
5: Public Hospital
6: Private Hospital
- Community Mental Health Service
4: Public mental health service
- Other
All the other codes (1-3,8-21,98,99)
Service Contact Data
The service contact section of the report is concerned exclusively with the Service Contact - Modality on attended service contacts <https://docs.pmhc-mds.com/projects/data-specification/en/v2/data-model-and-specifications.html#attended-service-contact>. For all contacts in the relevant period it is a simple count of the number of contact each modality:
1: Face to Face
2: Telephone
3: Video
4: Internet-based
Client Measures and Experience
Information about three clinical measures is reported in this section. For each measure there are three summary statistics:
The number of episodes with (valid) initial measures collected during the reporting period
The number of episodes with (valid) final measures collected during the reporting period
The number of episodes with at least two (valid) outcome measures, at least one of which must be collected during the reporting period
Information about collection occasions - including dates and reasons - is available in the Collection Occasion specification documentation. A critical feature of a collection occasion is its “reason”, which is actually about the point in the clients’ journey when the measure was taken. For reporting purposes this can be either “inital” (i.e. start of the episode) or final (end of the episode). Note however that the collection occasion dates need not be the same as the episode start and end dates. Measures can be collected on any day.
The specific measures of interest are the K5/K10+ and the SIDAS. The WHO-5 was formerly reported but was removed in the report update of September 2022. Information about these measures - including what constitutes a valid measure - can be accessed in the Collection Occasion Key Concepts documentation.
The two Kessler measures (K10+ and K5) are treated interchangeably in this section of the report. Additionally, for the ‘Initial’ and ‘Exit’ measures columns multiple measures of the same type are counted once only. So for example, 2 SIDAS marked as ‘Final’ for the same episode will only add 1 to the count. An episode with initial K5 and K10+s also only adds 1 to the count of ‘Initial Measures’, however this combination also adds 1 to the count of “Number of Paired Measures During Period”, provided at least one of the measures was taken during the reporting period.
Although there should be no cases where an episode has multiple instances of a particular measure taken at any collection occasion identified as initial or final, if such an anomaly occurs the CO is still included as having the initial/final/paired measure. In other words the technical definition of “having a measure” is interpreted as “having one or more instances of the relevant measure”.
Issues and Risks
This section counts client deaths and suicide attempts during the relevant reporting period and year-to-date. Details about such events are available in the TWB Critical Incident - Date documentation. Codes 2 and 3 comprise deaths; code 1 indicates a suicide attempt.
Key Performance Indicators
The KPIs produced by the automated reports are all based on particular events occurring within a certain number of days of a precipitating event. KPIs pertain to the reporting period only.
Each KPI reports a reference population (the number in the ‘Calc B’ column) and the subset of that population that meets the criteria in the ‘Target Metric’ column (‘Calc A’). Note that a population in this case means a count of episodes, not a number of people. The ratio is presented as a percentage in the ‘% Achieved During’ column.
Business days are defined as Monday to Friday inclusive, unless they are listed in Australian Public Holidays shown within the information at the Digital Transformation Office. The business day calculator takes into account the jurisdiction (state or territory of the service). A week is defined as 5 business days.
Safety Plan Update / Development
The relevant episodes here are those where the first attended service contact is within the reporting period, and the the episode has an initial collection occasion with a corresponding TWB Plan - Plan Type equal to 1: Safety Plan. The numerator is the subset of these episodes for which the collection occasion date is before or on the same day as the first attended service contact.
Please note: Prior to September 2022 it had to be on or before the date of the second attended service contact.
Support Plan Development
The relevant episodes here are those where the first attended service contact is within the reporting period, and the episode has an initial collection occasion with a corresponding TWB Plan - Plan Type equal to 2: Support Plan. The numerator is the subset of these episodes for which the collection occasion date is not more than 10 days after the initial attended service contact.
Report W2 — High level summary of overall volumes by entity
The W2 provides an overview of The Way Back (TWB) activity undertaken during the reporting period. It uses the same assumptions as the standard A1 report. It is a ‘one page’ view, with data aggregated for the specified reporting period, covering counts of clients, episodes and service contacts.
Key specifications:
Data in this report is all associated with an Active TWB Episode, as shown in the ‘Active Episodes’ column counts. This means the episode must appear in the TWB Episode table, and must have an Active Contact during the reporting period. A ‘!wayback’ tag on the main episode table is NOT sufficient for the episode to be included in this report.
The ‘Active Contacts’ column counts all the Attended Service Contacts (i.e. non-no show) that occurred during the reporting period that were associated with an Active TWB Episode.
The ‘Active Clients’ column counts the number of unique clients who were the recipient of services delivered as part of an Active TWB Episode.
Report W3 - Data Quality Report: Missing TWB Episode data
The W3 is a summary The Way Back (TWB) format report that provides a simple listing of missing/invalid data rates for relevant TWB Episode data elements. It is analogous to the standard A4 report that deals with the standard PMHC Episode elements with missing data.
Key specifications:
As for the W2, data in this report is all associated with an Active TWB Episode; however, for this report there is slightly tighter criteria regarding what it means to be active. Rather than the usual one or more attended service contact during the reporting period, for the W3 and W4, there must be at least TWO such contacts (i.e. non-no shows) during the reporting period). The episode must appear in the TWB Episode table. This number is reported in the column labelled ‘Number of active episodes in period’.
The ‘Number of active episodes with missing data’ column counts, separately for each of the TWB Episode record elements, how many episodes have the pertinent missing value code. For the elements “Method of Suicide Attempt” and “Primary Nominated Professional”, ‘Other’ (code 98) is counted as a missing value as well as ‘Not stated/Inadequately described’ (code 99).
The ‘% Missing Data’ column is a simple percentage of the active episodes that have missing data, calculated from the preceding two columns.
Report W4 - Data Quality Report: Missing TWB Needs Identification and Recommendation Outs
The W4 is a summary The Way Back (TWB) format report that provides a simple listing of missing/invalid data rates for relevant TWB Needs Identification and TWB Recommendation Outs data elements. It does the same job for these elements as the W3 does for TWB Episode data elements, and uses the same assumptions. Key specifications:
As for the W2, data in this report is all associated with an Active TWB Episode; however, for this report there is slightly tighter criteria regarding what it means to be active. Rather than the usual one or more attended service contact during the reporting period, for the W3 and W4, there must be at least TWO such contacts (i.e. non-no shows) during the reporting period). The episode must appear in the TWB Episode table. This number is reported in the column labelled ‘Number of active episodes in period’.
The ‘Number of active episodes with missing data’ column counts, separately for each of the TWB Episode record elements, how many episodes have the pertinent missing value code. For both elements “Needs Identification” and “Recommendation Out”, ‘Other’ (code 98) is counted as a missing value as well as ‘Not stated/Inadequately described’ (code 99).
The ‘% Missing Data’ column is a simple percentage of the active episodes that have missing data, calculated from the preceding two columns.